14 human cell lines commonly used in labs around the world were analyzed using TMT10plex. A mixture of peptides from all 14 cell lines (numbered below) was used to standardize the quantitation across multiple 10-plexed experiments. Relative protein abundance in each cell line compared to the control mix was calculated and color-coded to reflect proteins that were higher abundance than control (green) or lower abundance compared to control (red).
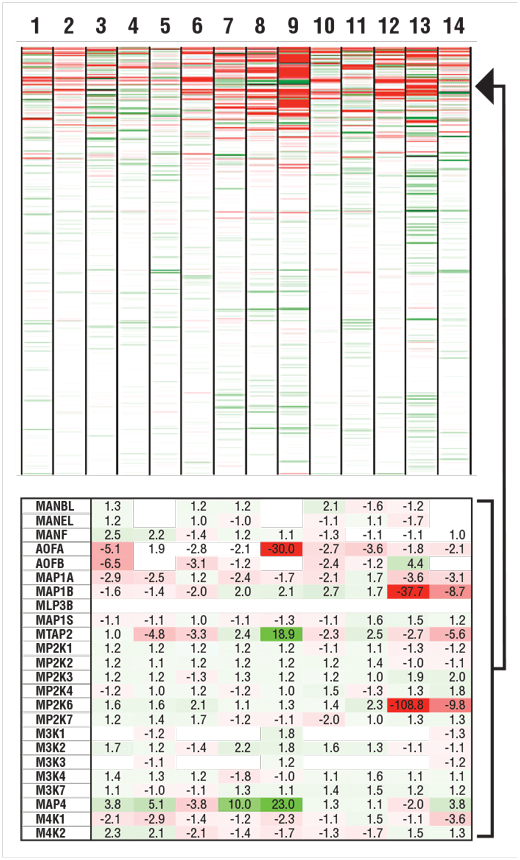
Heat map of color-coded relative protein abundances measured with TMT10plex across 14 human cell lines (numbered). Over 8000 proteins were quantified (upper), and a subset of data points shown with color coding and % change in abundance relative to control mix (lower).
Clients can view data globally using hierarchical clustering or other tools, and can review individual protein data in the tables.
TMT10plex data was compared to to western blots (WB) to validate protein abundance measurements. TMT quantitation shows good agreement with WB. FoxA2 and CD3ε expression levels varied with cell line, while Erk1 and Erk2 exhibited less cell line-dependent variation in expression.
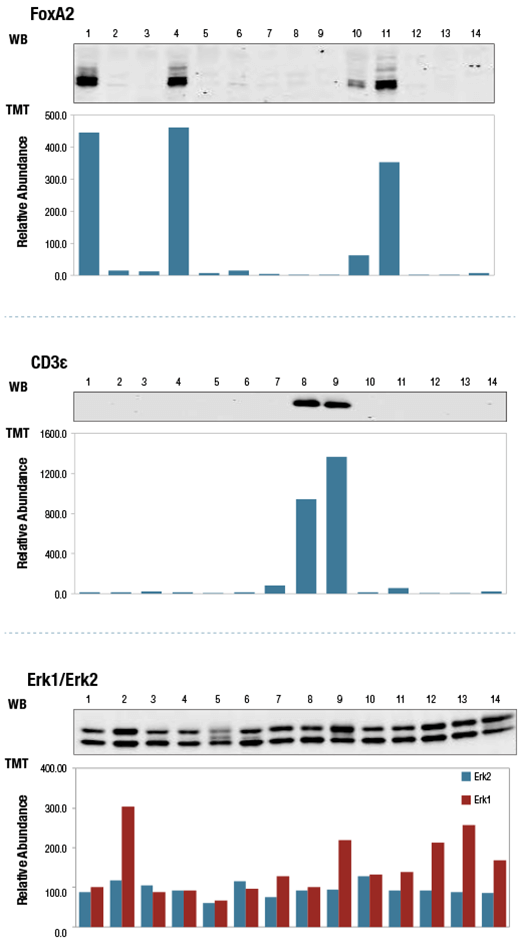
Relative protein abundance quantitation in 14 human cell lines (numbered) by TMT10plex profiling (bar graphs) and aligned western blots for FoxA2 (upper), CD3ε (middle) and Erk1/2 (lower).
These data demonstrate the ability of the TMT10plex Total Proteome method to provide detailed, quantitative information on relative protein abundance from multiplexed samples.